
Radon Risk Levels: A Practical Radon Chart and What to Do at Each Level
After you test for radon, you get a number. That number is helpful only if you know what it means and what to do next. This post gives you a clear radon level chart, explains how to interpret your result, and outlines practical next steps based on widely used guidance.
Radon is a naturally occurring radioactive gas that can build up indoors. You cannot see it, smell it, or taste it. Radon risk is tied to long-term exposure, so the most important idea is this: your decision should be based on your average radon level over time, not a single hourly spike.
What radon levels are measured in
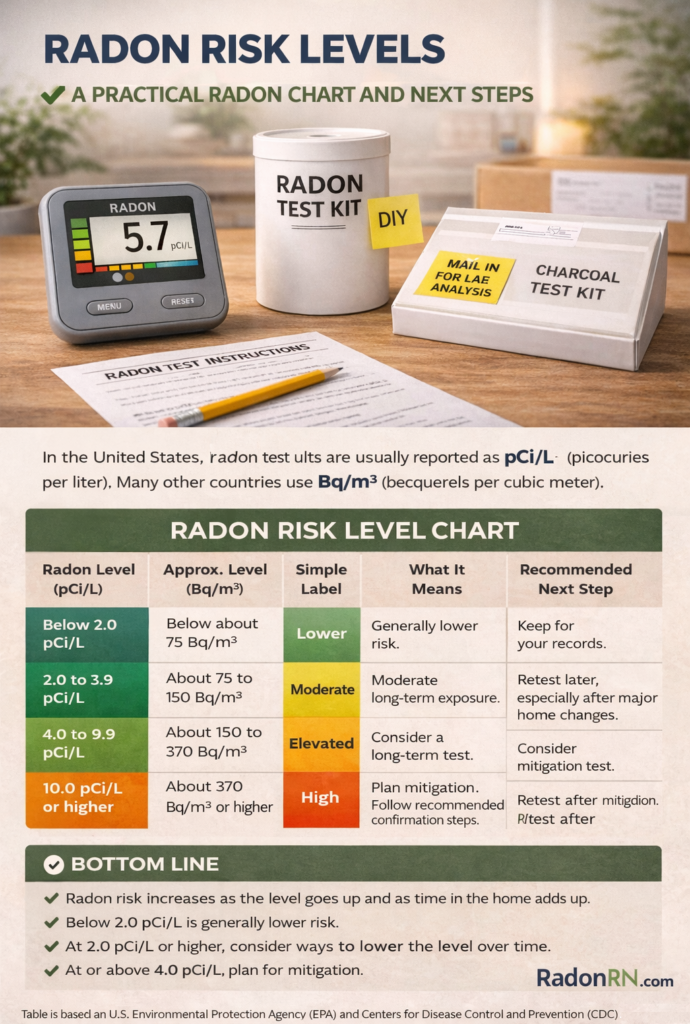
In the United States, radon test results are usually reported as pCi/L (picocuries per liter). Many other countries use Bq/m³ (becquerels per cubic meter). You may see both units on test reports and on digital monitors.
As a rough reference, 4.0 pCi/L is commonly shown as about 150 Bq/m³. That conversion is useful when comparing guidance from different countries and organizations.
Two key points before you use the chart
1) Radon risk is a sliding scale
Radon does not suddenly become dangerous at one exact number. Risk increases as radon level increases, and it also increases as time exposed increases. Many agencies note there is no known completely safe level, so the goal is to keep levels as low as reasonably achievable.
2) Smoking changes the risk dramatically
Radon increases lung cancer risk for everyone, but the combined risk is much higher for people who smoke or used to smoke. That does not mean radon is only a smoker’s issue. It means elevated radon is even more important to address in households with current or past smoking exposure.
Radon Level Chart
Use this table as a practical decision guide. It combines common U.S. action thresholds with a simple framework for what to do next.
| Radon Level (pCi/L) | Approx. Level (Bq/m³) | Simple Label | What It Means | Recommended Next Step |
|---|---|---|---|---|
| About 0.4 pCi/L (typical outdoor air) | About 15 Bq/m³ | Baseline | This is roughly the normal level in outside air. Indoor levels are often higher because radon can accumulate. | No action needed. Use as context only. |
| Below 2.0 pCi/L | Below about 75 Bq/m³ | Lower | Generally considered lower risk compared with higher readings, but not zero risk. | Keep the result for your records and retest in the future, especially after remodeling or HVAC changes. |
| 2.0 to 3.9 pCi/L | About 75 to 150 Bq/m³ | Moderate | Below the EPA action level, but still meaningful for long-term exposure. Many agencies recommend considering reduction in this range. | Consider a long-term test (90+ days) to estimate your true average. Consider mitigation if you spend lots of time on the lowest level or if there is smoking history in the household. |
| 4.0 to 9.9 pCi/L | About 150 to 370 Bq/m³ | Elevated | At or above the EPA action level. Standard guidance recommends fixing the home at these levels. | Plan mitigation. If the first test was short-term, follow recommended confirmation steps (often a long-term test or an average of two short-term tests). Retest after mitigation. |
| 10.0 pCi/L or higher | About 370 Bq/m³ or higher | High | High radon level. Long-term exposure at this range is a strong reason to act quickly. | Move toward mitigation as soon as practical. Consider confirming with a short follow-up test if needed, but do not delay action for long. |
How to use the chart with different test types
Your next step depends not only on the number, but also on how that number was measured.
Short-term tests
Short-term tests are often used for quick screening and real estate decisions. They can be very useful, but they represent a limited time window. Weather and ventilation can shift results during a short test.
How to interpret a short-term result:
- Well below 2.0 pCi/L: usually reassuring. Retest later if conditions change.
- 2.0 to 3.9 pCi/L: consider a long-term test to better estimate your true average.
- 4.0 pCi/L or higher: treat as actionable. Follow guidance on confirmation and mitigation planning.
Long-term tests
Long-term tests are designed to estimate your average exposure. If a long-term test comes back elevated, that is a strong signal that mitigation is worth doing because it reflects sustained conditions.
How to interpret a long-term result:
- Below 2.0 pCi/L: generally lower long-term exposure.
- 2.0 to 3.9 pCi/L: moderate long-term exposure. Consider mitigation based on your situation and risk tolerance.
- 4.0 pCi/L or higher: sustained elevated exposure. Mitigation is recommended.
Digital radon monitors
Digital monitors are useful for trends and for understanding how your home behaves. The mistake is treating a single day or a single spike as the truth.
Use this approach:
- Focus on the longest average your monitor provides (often 30-day or longer).
- Use shorter averages to learn patterns, not to make final decisions.
- If your longer average stays in the moderate or elevated range, confirm with a recognized test method if you want a clear benchmark.
-
Radon Risk Levels Infographic
What to do when your result is close to a threshold
Borderline results are common. If your test result is near 4.0 pCi/L, you have three practical options:
- Run a long-term test to estimate your true average over time.
- Run a second short-term test and use the average, if that fits your situation and guidance you are following.
- Choose to mitigate based on the idea that lower is better, especially if the basement is used heavily or there is smoking history.
In many homes, mitigation can reduce radon significantly. Some EPA guidance notes that with current technology, radon levels in many homes can be reduced to 2.0 pCi/L or lower.
Factors that make the same radon number more or less important
Two homes can have the same radon level, but the practical risk can differ based on how people use the space.
Consider taking action sooner if:
- You spend many hours per day in the lowest level (home office, basement bedroom, basement living room).
- You work from home and have high time indoors.
- Someone in the household smokes or used to smoke.
- You plan to stay in the home for many years.
Consider confirming with a long-term test if:
- Your short-term result is in the 2.0 to 4.0 pCi/L range and you want clarity.
- Your digital monitor shows mixed results and you want a lab-based average.
After mitigation: what levels should you aim for?
After a mitigation system is installed, retesting is essential. The goal is a clear reduction, and many homeowners aim for levels below 2.0 pCi/L when feasible. If your post-mitigation result is still elevated, the system may need adjustment or additional diagnostic work.
Even after a successful mitigation, retesting over time is smart, especially after major home changes like finishing a basement, adding HVAC equipment, or doing foundation repairs.
Bottom line
A radon test result is only useful if it leads to the right next step. Use the chart above to put your number in context. Below 2.0 pCi/L is generally lower. Between 2.0 and 4.0 pCi/L is moderate and worth addressing in many homes, especially with high time indoors or smoking history. At or above 4.0 pCi/L is the EPA action level where mitigation is recommended. Above 10.0 pCi/L is high and should prompt quicker action.
Radon is invisible, but it is measurable. Once you know your level, you can make a clear decision and reduce long-term risk.
Sources
- U.S. Environmental Protection Agency (EPA) – EPA action level for radon and what it means
- Centers for Disease Control and Prevention (CDC) – Testing for radon in your home
- U.S. Environmental Protection Agency (EPA) – Radon measurement units explained (pCi/L, WL, Bq/m³)
- EPA – Consumer’s Guide to Radon Reduction (PDF)
- CDC – Reducing radon levels in your home
- World Health Organization (WHO) – Radon and health